The unit cost estimator uses statistical methods to generate a cost per outpatient visit or inpatient admission for a healthcare facility using a set of key variables. To develop the tool, a cost function model was constructed using data from the National Health System Cost Database – data
The aim of the cost function is to predict unit costs of healthcare services in different settings, at different service volumes by nature of service delivery (inpatient and outpatient care) and identify the degree to which other factors influence average costs. Unit costs are dependent on the total costs of input resources consumed (numerator) and output in terms of services provided (as denominator). hotal costs can broadly be divided into the total components i.e. human workforce, capital resources (like building and equipment) and overheads; and those associated with specific treatments i.e. the costs of medicine, consumables and diagnostics, and are dependent on the beneficiaries. hotal costs generally comprise 70-80% of hospital costs [1,2]. Other costs i.e. of medicines, consumables and diagnostics are subject to different types of market influences than total type services with patients typically contributing to a large share of these inputs in India [3]. These costs tend to be variable so that the average cost remains constant as volume of services changes. ‘hotal costs’ are more fixed in nature, with average costs varying with scale as well as other characteristics that might shape the production of a particular service. The cost function is therefore designed to predict the ‘hotal costs’ component of total cost.
The starting point for the cost function is the WHO CHOICE refined model for predicting national level unit costs (version 2) 2017/18 [4]. This model regresses unit costs against a set of explanatory variables said to explain unit cost such that:
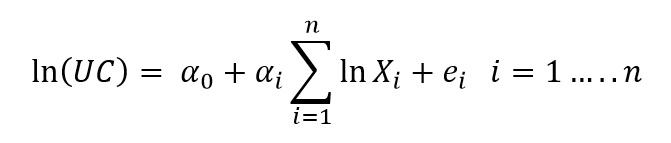
Where UC is unit cost, X_i are the explanatory variables and α_0 and α_(1……n) are the estimated parameters and e is the error term. The independent variables can include prices of labour and capital as well as other explanatory factors such as volume of services, geographical location, capacity utilisation, quality and the nature of the health care market [5–8]. To estimate unit costs for a particular service within a large production unit, a regression model can be run separately for each different service based on the assumption that the production relationship between different services at any single facility is constant. In this case, separate models were run for inpatient care and outpatient care.
A range of explanatory variables were considered for inclusion in the model based on a combination of theoretical considerations and previous cost models (for example: [4,5,9–11]. To identify the best specification, guided stepwise linear regression was used. The variables considered included the outputs of each service category, prices and quantities of labour, proxy of capital and any other significant inputs into production as well as supply side factors that might lead to cost variation [12]. Importantly, the models needed readily accessible data so that a user could predict costs for their settings.
Following Serje et al, 4 categories of labour should be considered [13]: professional, technical/auxiliary, support, clerks/secretaries, physical labourers. However, our data only allowed distinction between 3 categories: doctors, medical support staff (nurses/ technicians/ pharmacists) and other support staff. The capital stock can be represented by the number of beds at the facility for both inpatient and outpatient services. Number of beds gives an indication of the relative capital stock even where inpatient beds are equal to zero. Outputs used are hospitalisations for the inpatient model and outpatient visits for the outpatient model.
To account for the influence of supply side factors we considered the use of the level of health facility, capacity utilisation and state level per capita health expenditure as well as 2 proxy variables to represent quality and the nature of the health care market. These proxies are the state health index which reflects a combination of health outcomes, governance and inputs to the health sector [14]; and we considered the use of the government “Aspirational District Programme” index – a composite index of socio-economic progress, health and education sector performance and basic infrastructure indicators[15].
The best fit models were then selected based on based on both statistical, theoretical and pragmatic considerations for each of the outpatient and inpatient cost functions. Base models for prediction were selected based on the trade-off between the data requirements and high predictive power of the model in terms of adjusted r-square. First, models with multi-collinearity (VIF scores >10) were excluded [16]. Subsequently models were listed in order of the adjusted r-squared. Starting with the model with the highest score, the models were assessed for their suitability to be used in the state level predictions, according to data availability and ability to interpret the coefficient of independent variable. The first model to fit these criteria was selected for the state level cost predictions.
Table 1 : Model Coefficients
Once selected the coefficients obtained from the best fit model were used in the construction of the unit cost estimator (Table 1). Unit costs can then be generated with uncertainty limits for facilities with different characteristics. The predicted unit cost generated from the models is a median value due to the log transformations. This is adjusted to the arithmetic mean by applying a smearing factor [4,17] . Uncertainty intervals around the predicted values are constructed by first generating a random sample of 1000 based on the mean and standard error of each of the coefficients in the model and extracting the values at the 5th and 95th percentiles.
The cost prediction models were validated by using data and results from preliminary findings of the ongoing national costing study funded by the Government of India [18]. Actual costs and the explanatory variables were extracted from the primary data collected from the sampled health facilities for this study. The explanatory variables were used to predict the facility unit cost estimates based on the state prediction models. The predicted cost estimates were then compared with the actual unit cost estimates generated as part of the 2020 national costing study.
| 1. |
Prinja S, Chauhan AS, Bahuguna P, Selvaraj S, Muraleedharan VR, Sundararaman T. Cost of Delivering Secondary Healthcare Through the Public Sector in India. PharmacoEconomics - Open. Springer International Publishing; 2019;1–13. |
| 2. |
Prinja S, Balasubramanian D, Jeet G, Verma R, Kumar D, Bahuguna P, et al. Cost of delivering secondary-level health care services through public sector district hospitals in India. Indian J Med Res.2017;12. |
| 3. |
Balarajan Y, Selvaraj S, Subramanian S. Health care and equity in India. Lancet. Elsevier Ltd; 2011;377:505–15. |
| 4. |
Stenberg K, Lauer JA, Gkountouras G, Fitzpatrick C, Stanciole A. Econometric estimation of WHO-CHOICE country-specific costs for inpatient and outpatient health service delivery. Cost Eff Resour Alloc. BioMed Central; 2018;16:11. |
| 5. |
Johns B, Baltussen R. Accounting for the cost of scaling-up health interventions. Health Econ. 2004;13:1117–24. |
| 6. |
Adam T, Ebener S, Johns B, Evans DB. Capacity utilization and the cost of primary care visits: Implications for the costs of scaling up health interventions. Cost Eff Resour Alloc. 2008;6:1–9. |
| 7. |
Cowing TG, Holtmann AG, Powers S. Hospital cost analysis: a survey and evaluation of recent studies. Adv Health Econ Health Serv Res. 1983;4:257–303. |
| 8. |
Smet M. Cost characteristics of hospitals. Soc Sci Med. 2002;55:895–906. |
| 9. |
Barnum H, Kutzin J. Public hospitals in developing countries: resource use, costs and financing. Baltimore, MD: Johns Hopkins University Press; 1993. |
| 10. |
Guinness L, Kumaranayake L, Hanson K. A cost function for HIV prevention services: is there a “u” - shape? Cost Eff Resour Alloc. 2007;5:13. |
| 11. |
Chatterjee S, Ghosh A, Das P, Menzies NA, Laxminarayan R. Determinants of cost of routine immunization programme in India. Vaccine. Elsevier; 2018;36:3836–41. |
| 12. |
Johns B, Torres TT. Costs of scaling up health interventions: a systematic review. Health Policy Plan. 2005;20:1–13. |
| 13. |
Serje J, Bertram MY, Brindley C, Lauer JA. Global health worker salary estimates: An econometric analysis of global earnings data. Cost Eff Resour Alloc. BioMed Central Ltd.; 2018;16. |
| 14. |
Niti Aayog. Healthy States, Progressive India. 2018. |
| 15. |
Niti Aayog. Transformation of Aspirational Districts. 2018. |
| 16. |
Tabachnick B, Fidell L. Tabachnick and Fidell- Fifth Edition (2007), Chapter 5”. Using Multivar Stat. 5th Editio. Pearson; 2007. |
| 17. |
Duan N. Smearing Estimate: A Nonparametric Retransformation Method. J Am Stat Assoc. Taylor & Francis, Ltd.American Statistical Association; 1983;78:605. |
| 18. |
HTAIn Department of Health Research. HTAIn Compendium [Internet]. 2018. Available from: http://htain.icmr.org.in/index.php/documents/publications/htain-compendium# |