Background Information
Cost database provides economic cost data for district hospitals, community health centres, primary care centres and sub-health centres from 6 states (Himachal Pradesh, Haryana, Punjab, Odisha, Kerala and Tamil Nadu).
The cost data collection methodology can be found here. To access the data, you first need to register here or log in.
Content of the database
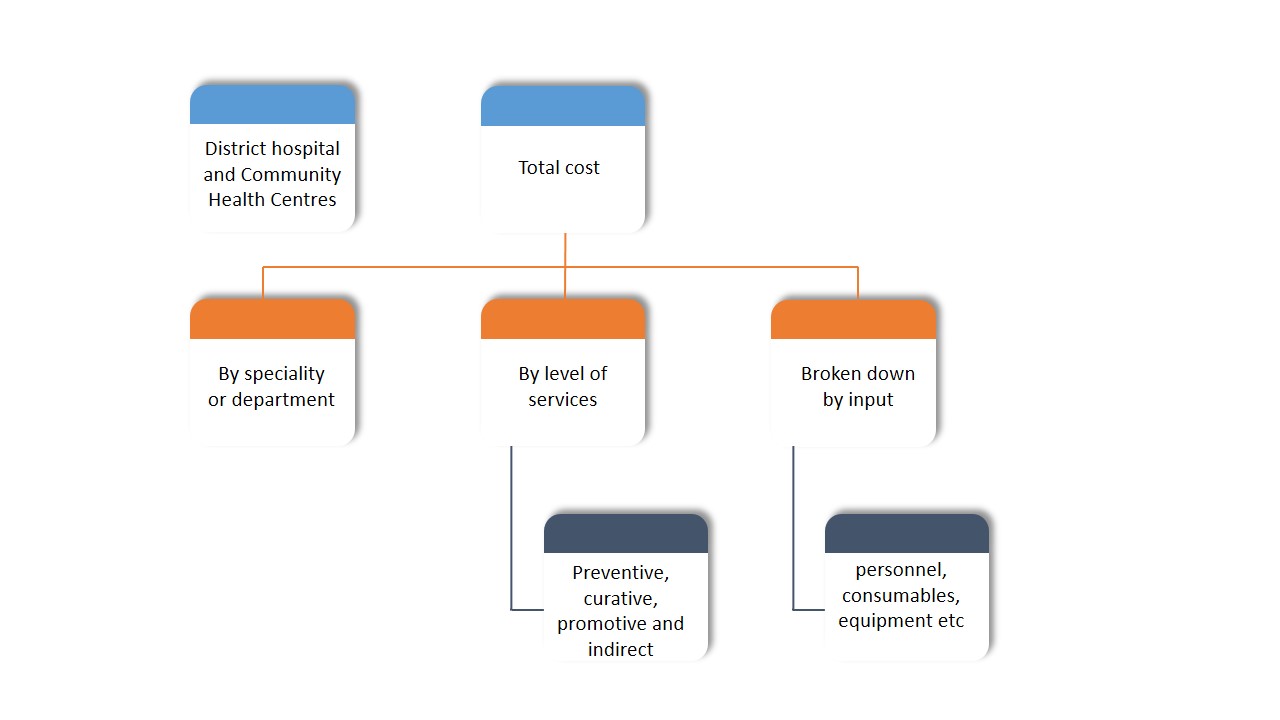
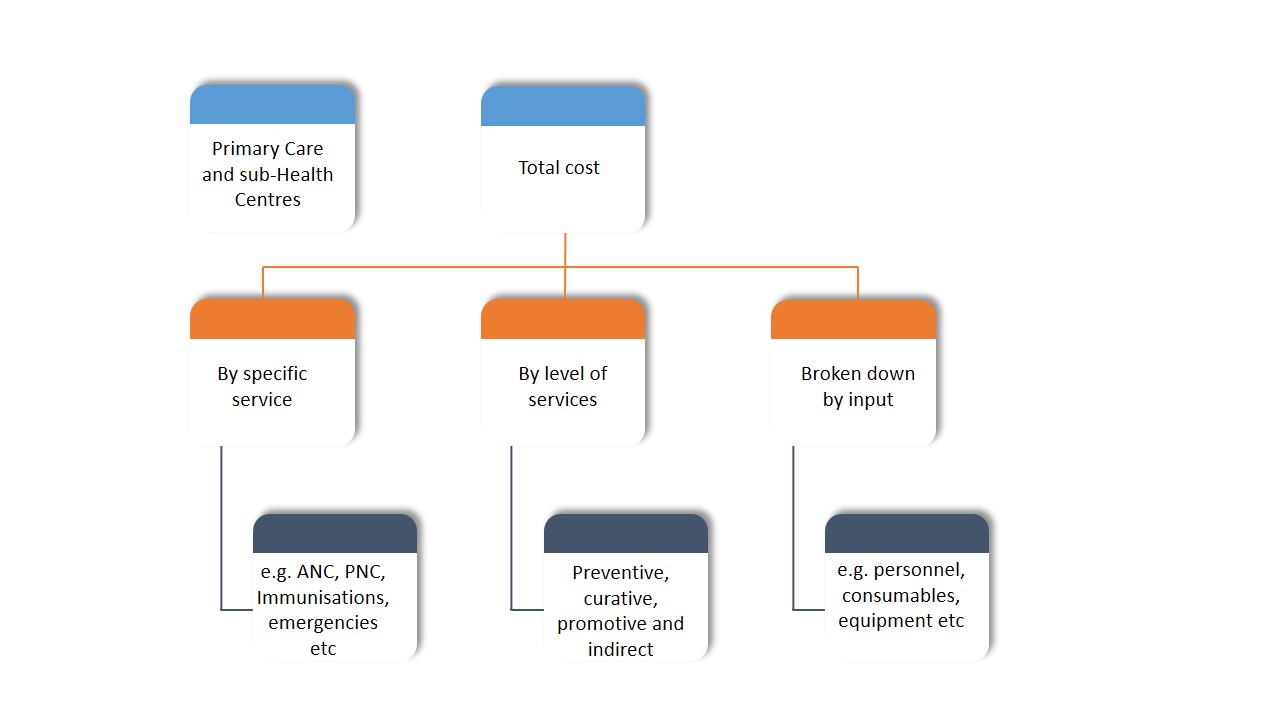
For each state and each facility level, it is possible to extract the mean annual cost of the facility (referred to as Total Cost) and costs per unit of output (referred to as Unit Cost) broken down inputs (personnel, consumables, equipment etc.), specialty or types of service and levels of service. The flowcharts below show the different breakdowns of data that can be accessed.
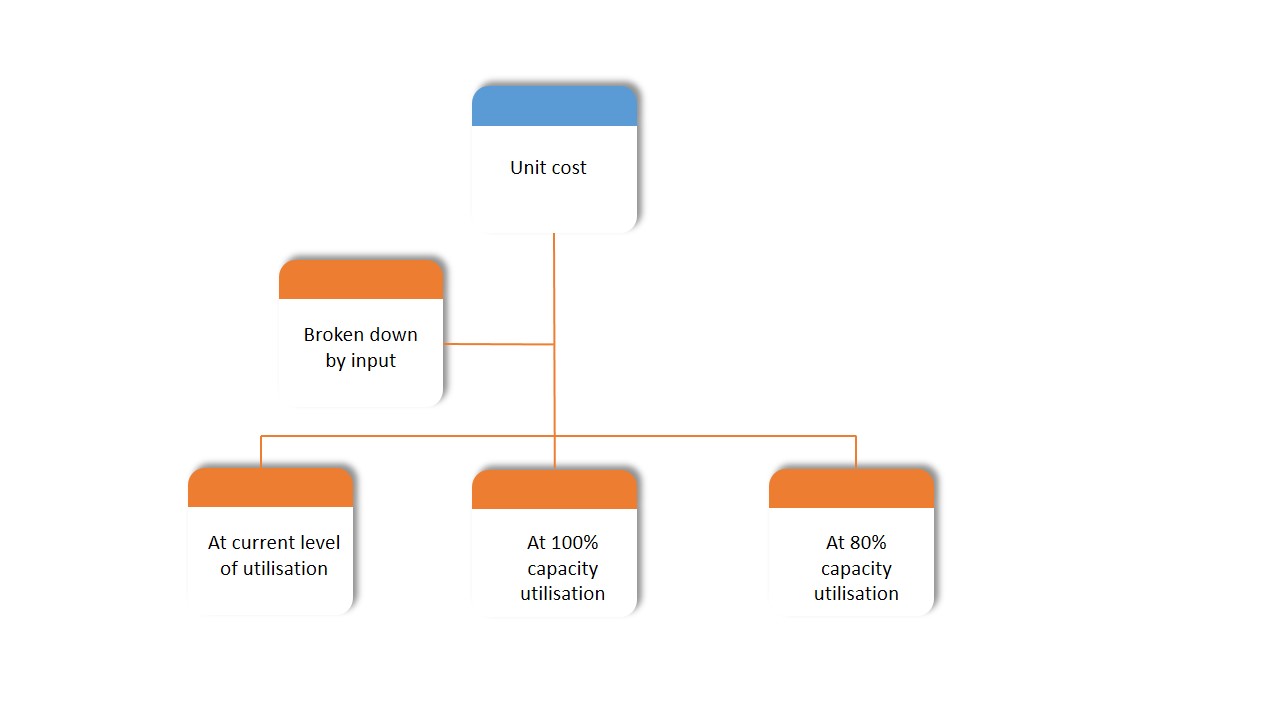
Costs are available for each service or specialty at a facility at the current levels of utilisation and with unit costs also available adjusted for different levels of capacity utilisation.
Flowchart 1:
Flowchart 1.1:
Flowchart 1.2:
Selecting Data
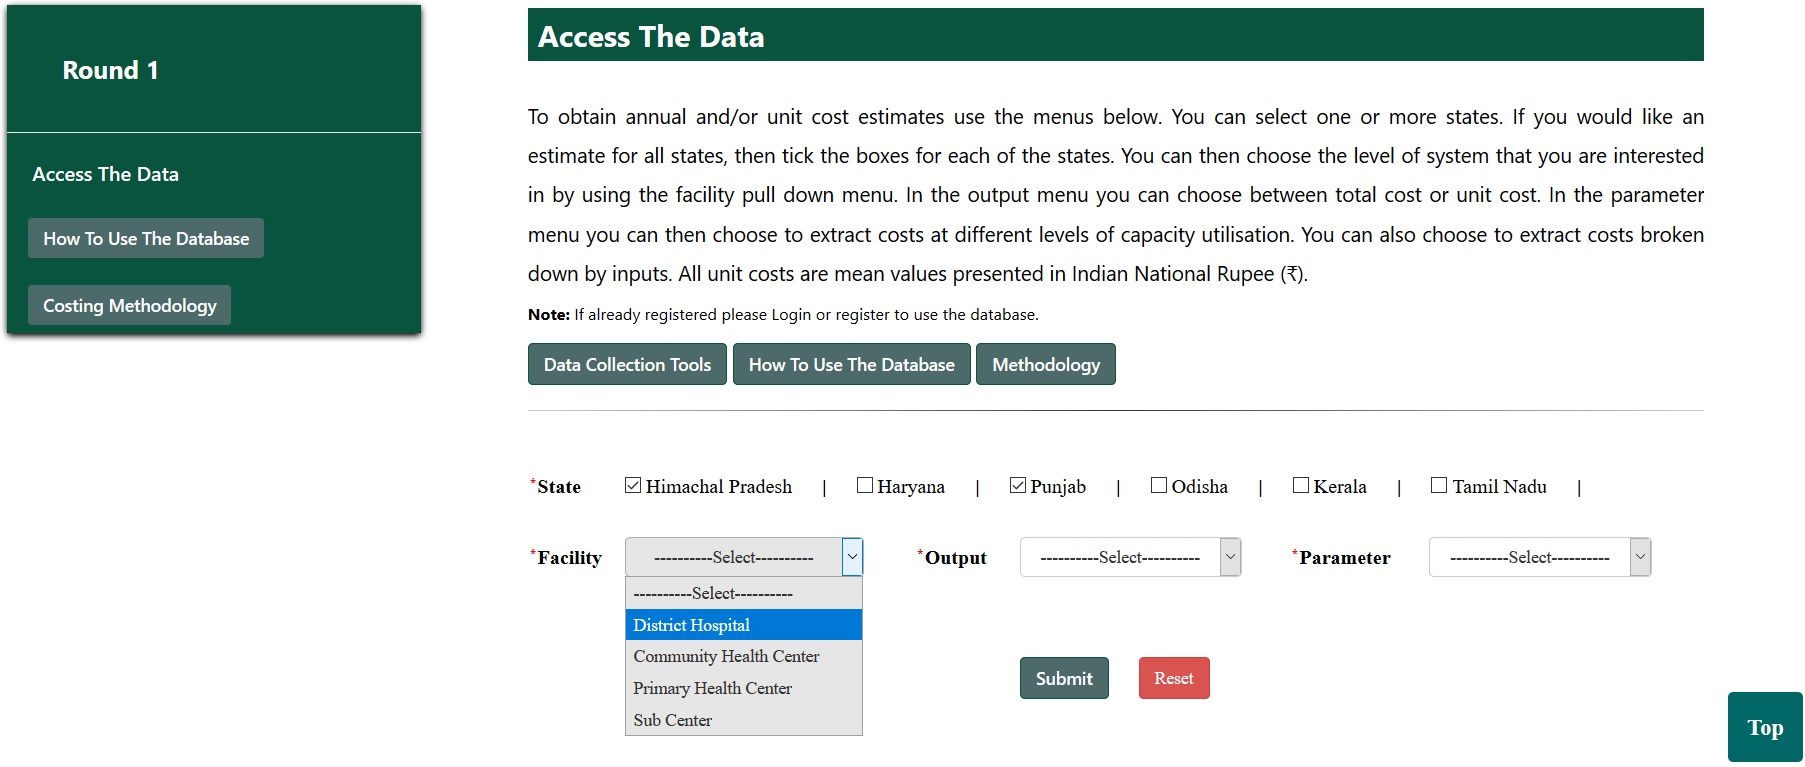
Step 1: First choose the health state and level of the health system
Once you have registered and logged in, you need to select the states you are interested in by clicking on the boxes next to the states of interest.
All the states name are showing on screen. You can select one or more states by clicking on checkbox. As shown in picture 1 below, Himachal Pradesh and Punjab have been selected. Once the states are selected, use the dropdown menu to select the level of facility required.
You can select whether you want data for District Hospitals, Community Health Centres, Primary Health Centres or Sub Health Centres. You will need to extract data for each level of the health system separately.
Picture 1:
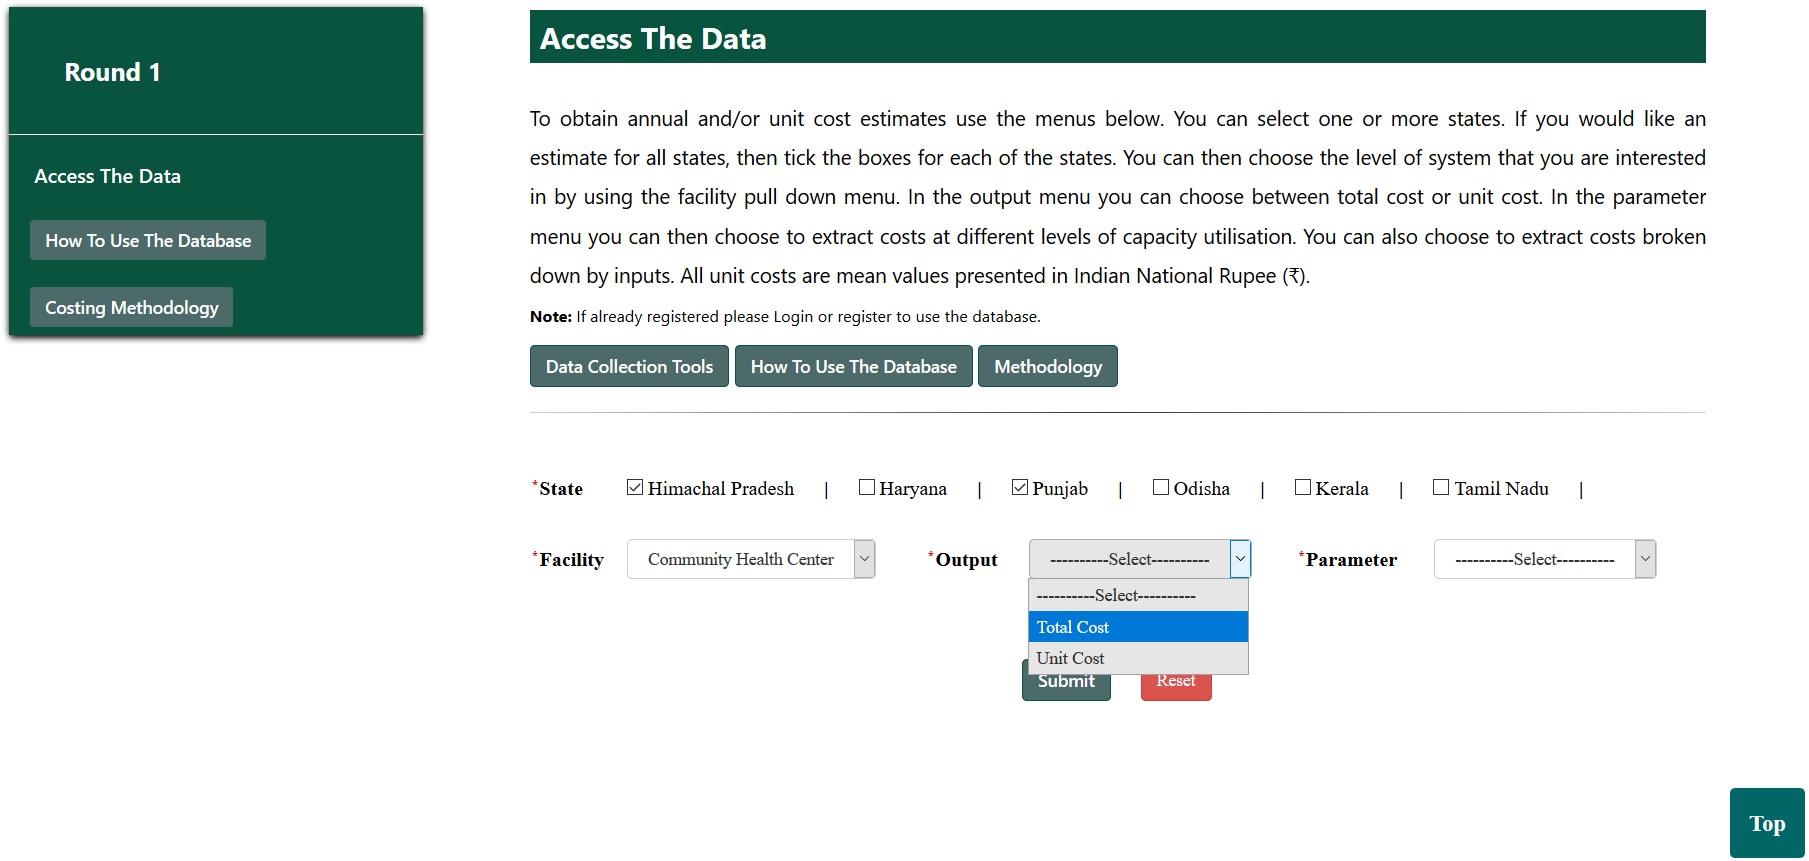
Step 2: Now choose the type of cost data
The next step is to decide on whether you want total cost or unit cost data. This can be selected from the “Output” dropdown menu as shown in picture 2 below.
Picture 2:
Step 3: Extracting Data
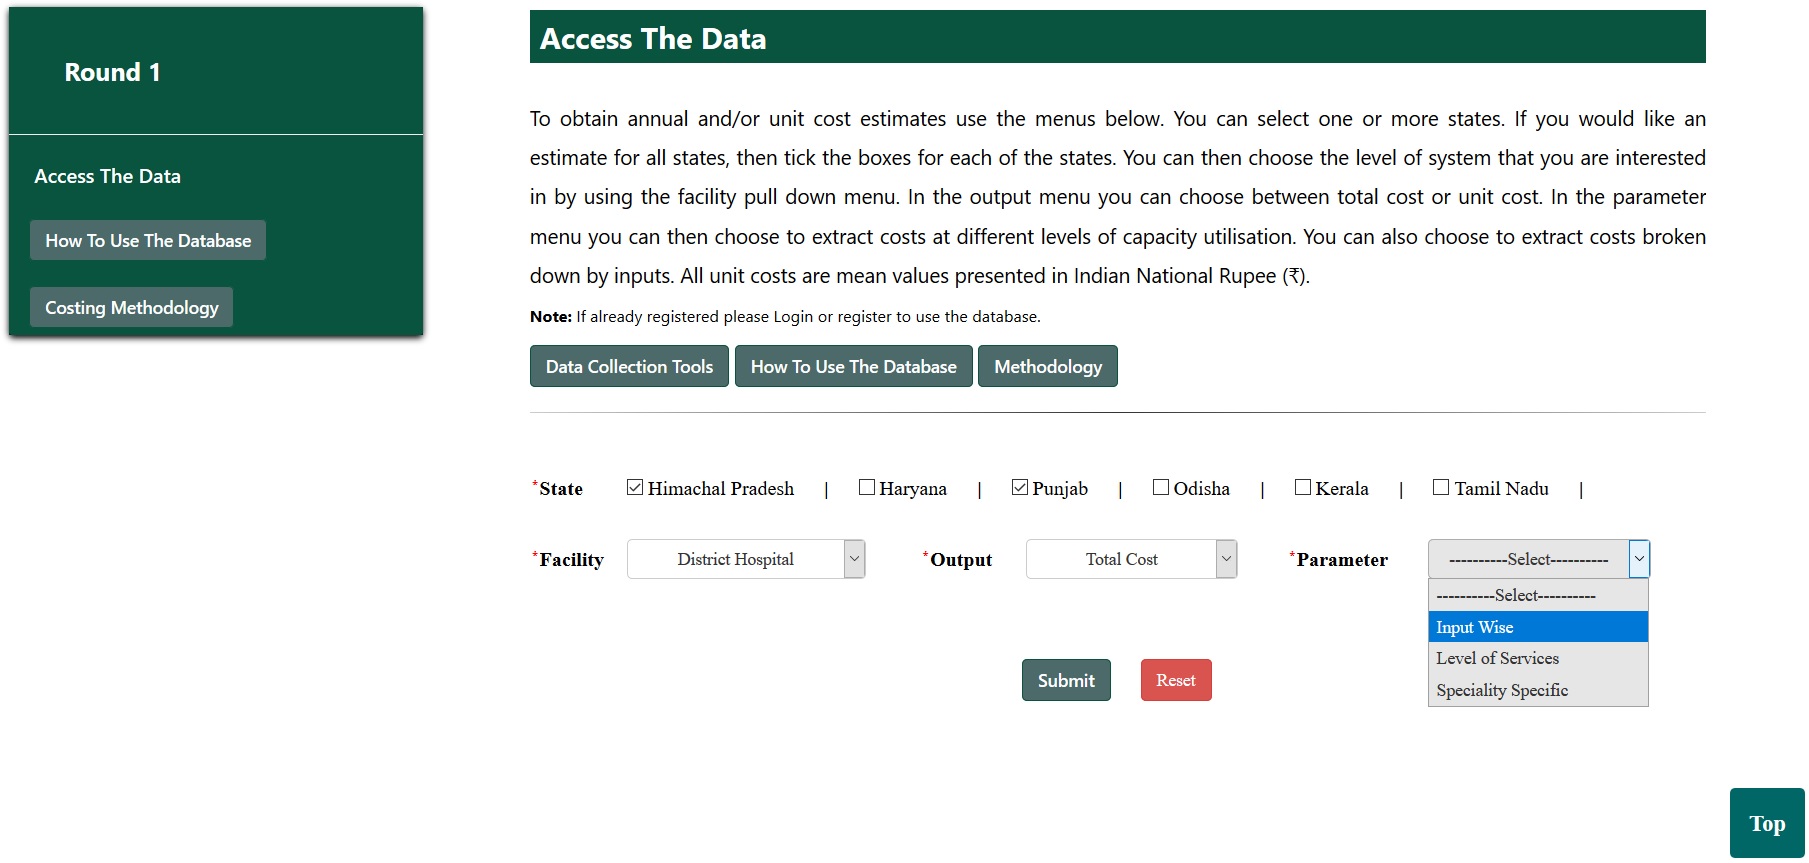
Data on Total Costs
If “Total cost” is selected, it is then necessary to decide and select how the data should be broken down in the “Parameter” menu.
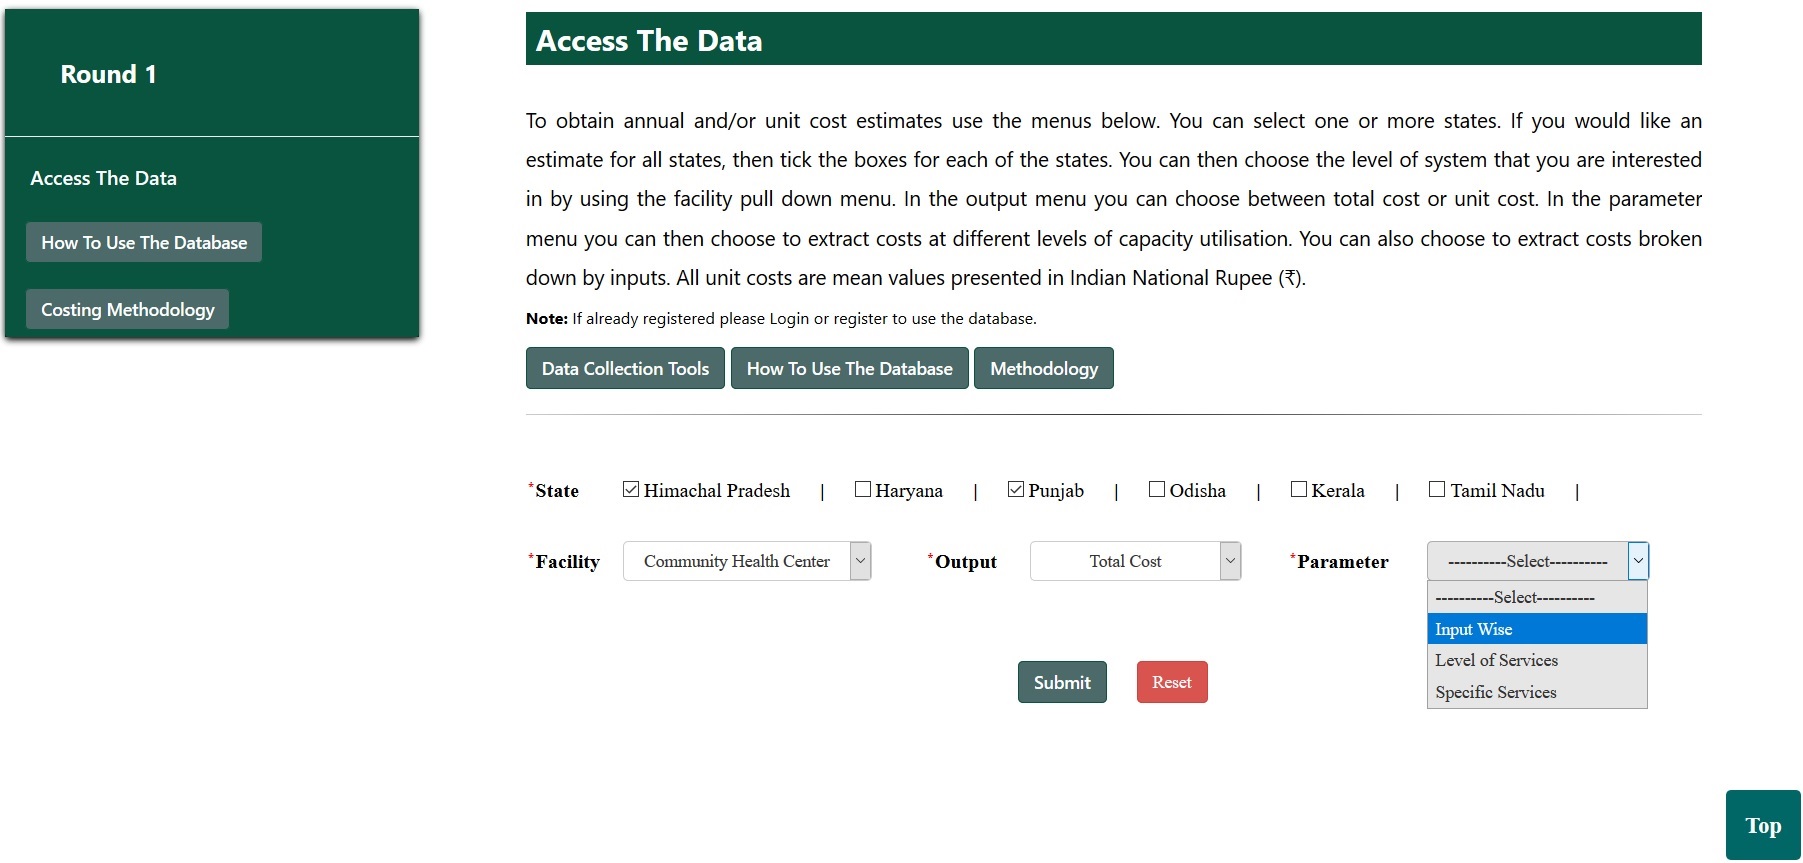
The breakdown options vary depending on the level of the facility. At the District Hospital, breakdown by specialty can be selected; whereas for all other levels the breakdown is by the specific services provided. Other breakdown options include input wise (personnel, consumables, building, equipment etc.) or by the level of services (preventive, curative or promotive).
The different options are shown in the picture 3 and 3.1 below. Once the parameter is selected, you can click on “Submit” to generate the cost tables.
Picture 3:
Picture 3.1:
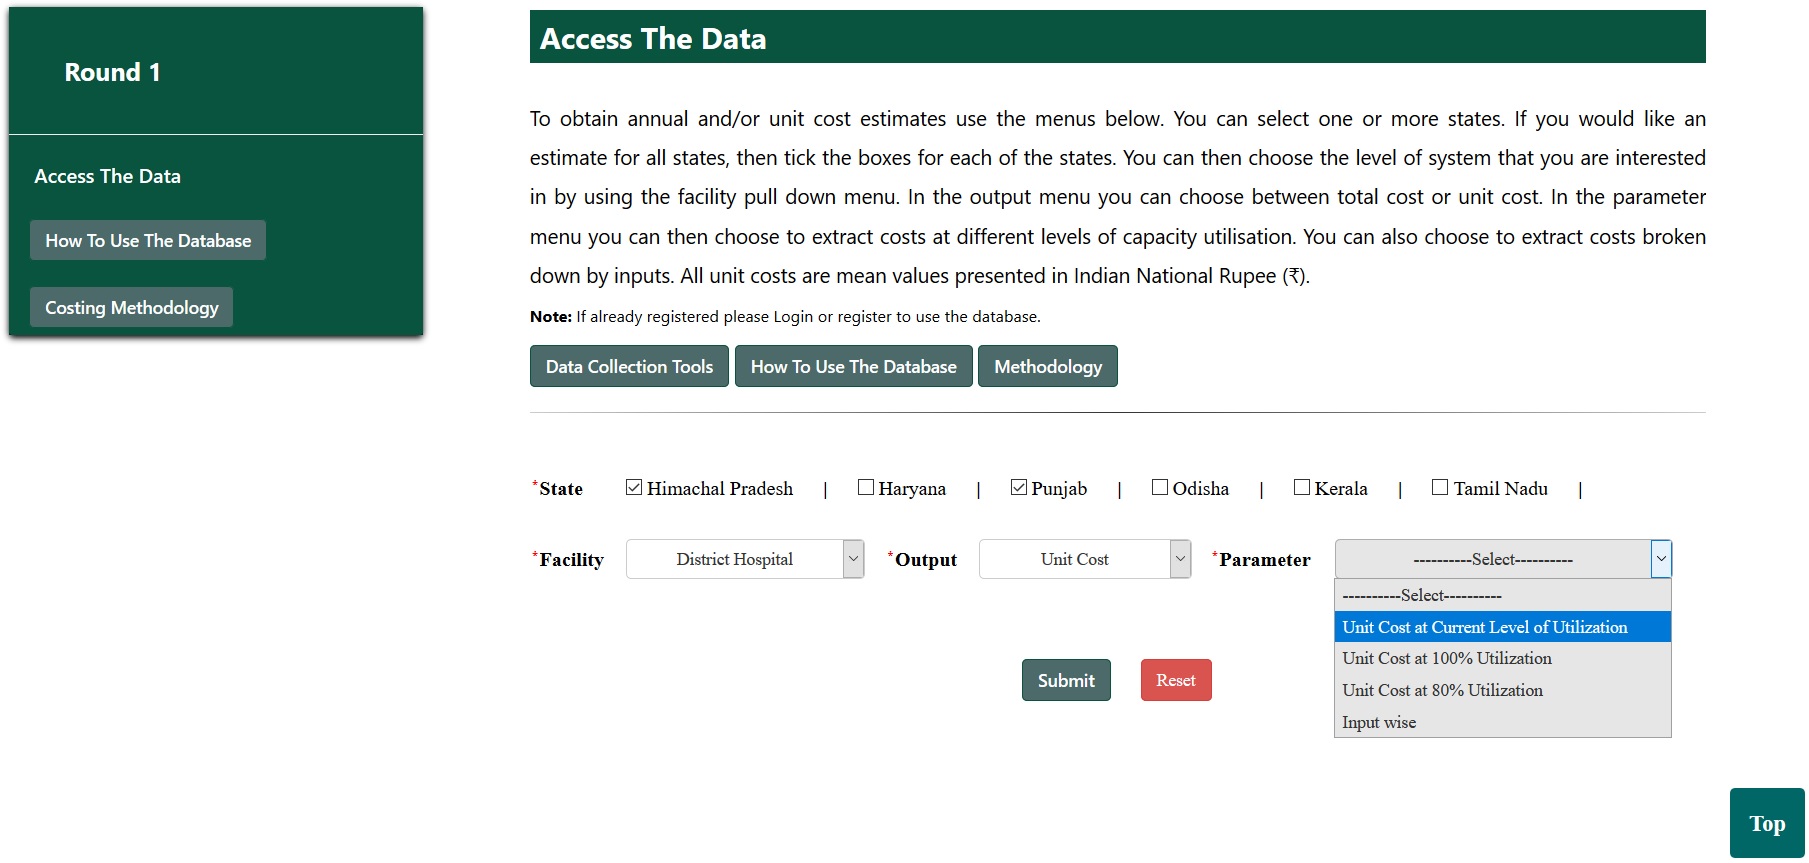
Unit Cost Data:
If “Unit cost” data are selected, you then need to choose whether you would like the unit costs with or without a breakdown by input.
Next you can choose whether to use the cost data as is – at current levels of utilisation or whether an adjustment for capacity utilisation is needed. This adjustment to the unit cost takes account of the fact that health facilities do not run at optimal capacity. Options for both 80% and 100% capacity utilisation are provided to generate the cost estimates at optimal capacity utilisation.
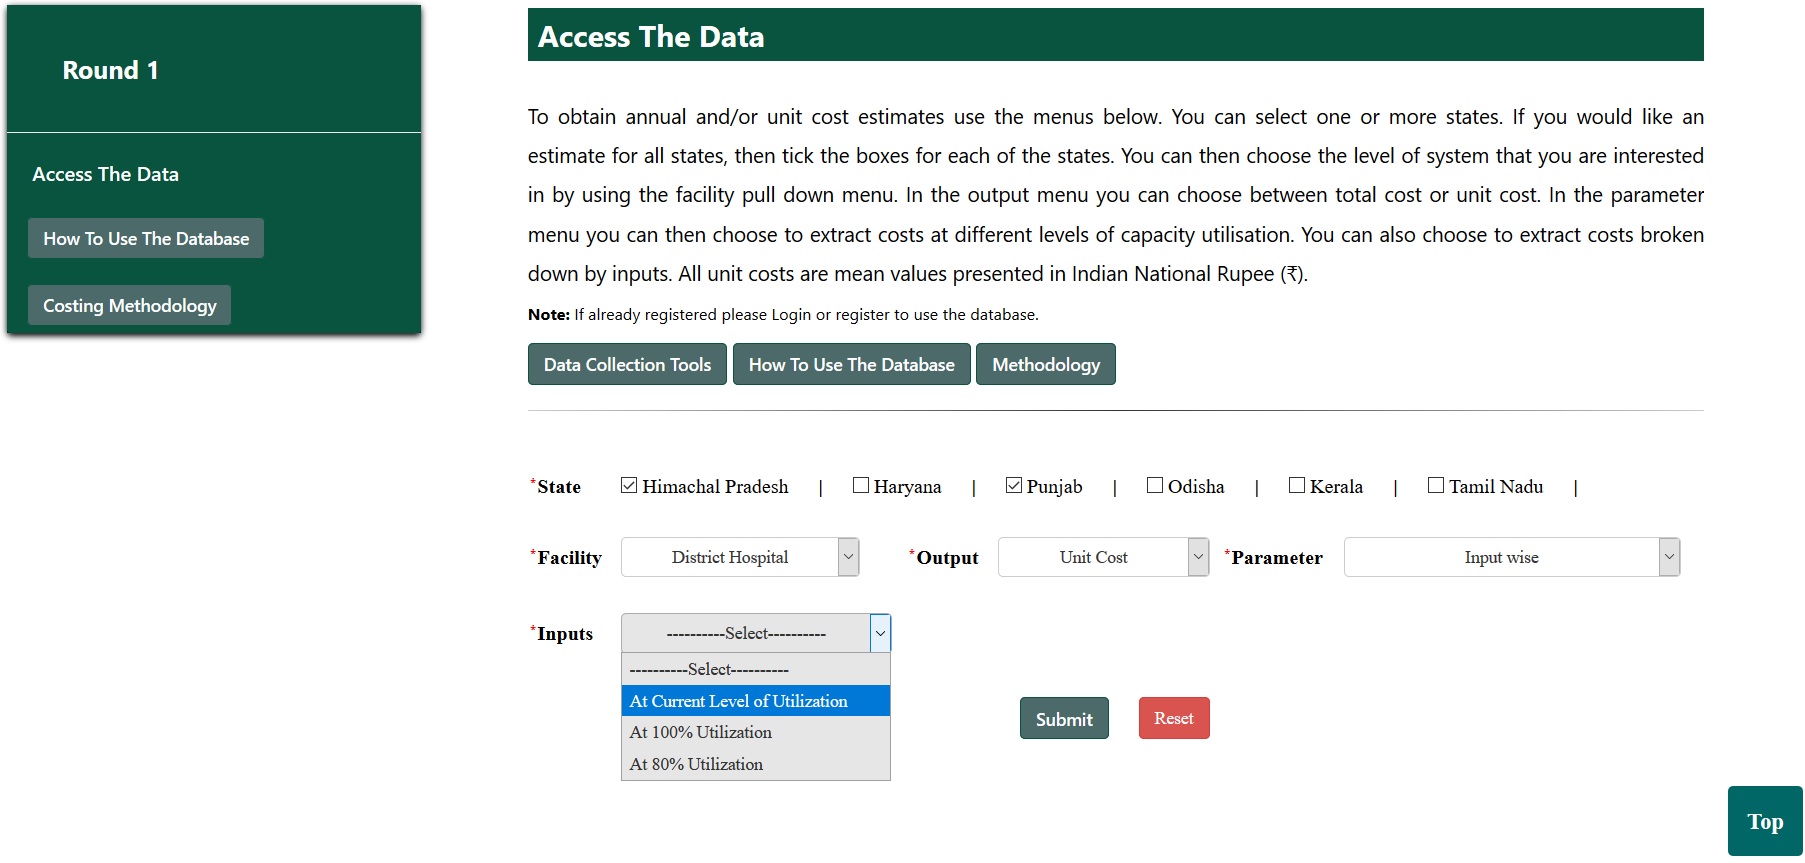
The picture 3.2 below show that if you select an input wise breakdown, another “Input” box appears along with the option to choose between the different levels of capacity. If you do not need the input wise breakdown, you can select the level of capacity utilisation in the “Parameter” box.
Once the “Parameter” and “Inputs” (if needed) have been selected, click on submit to extract the unit cost data tables.
Picture 3.2:
Picture 3.3:
Step 4: Downloading Output Tables
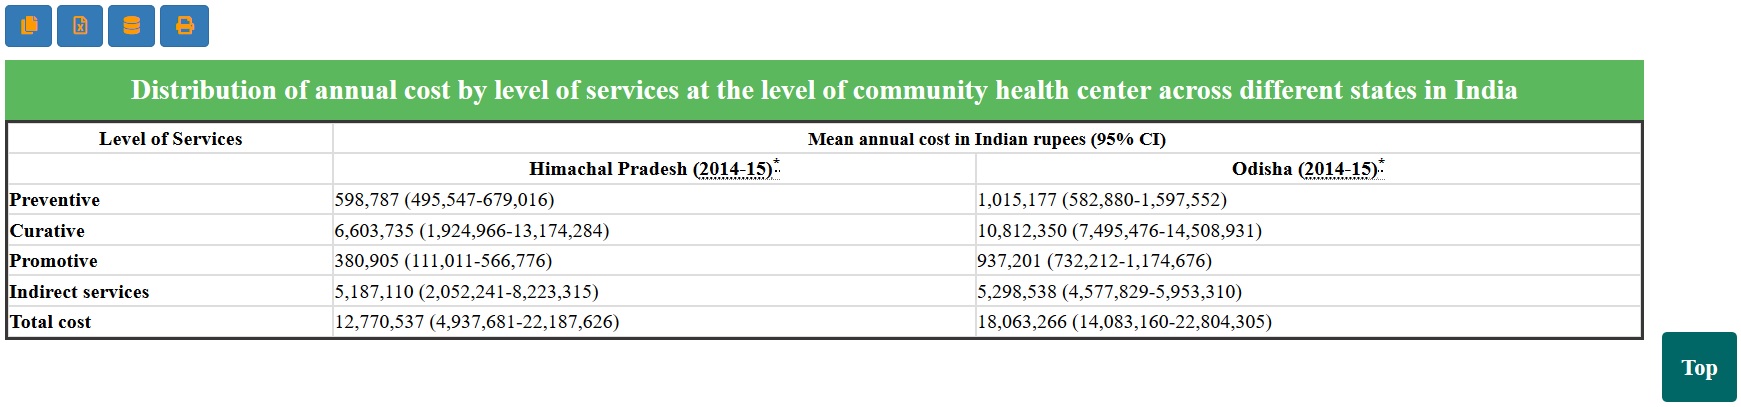
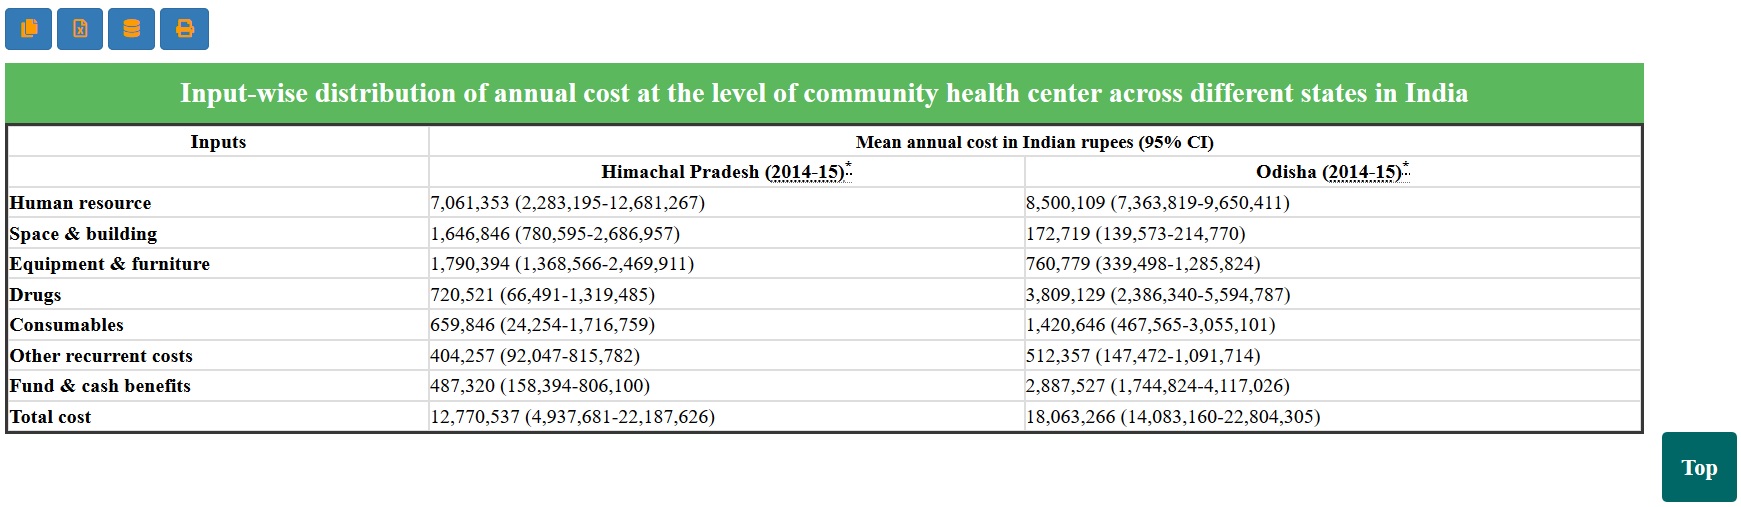
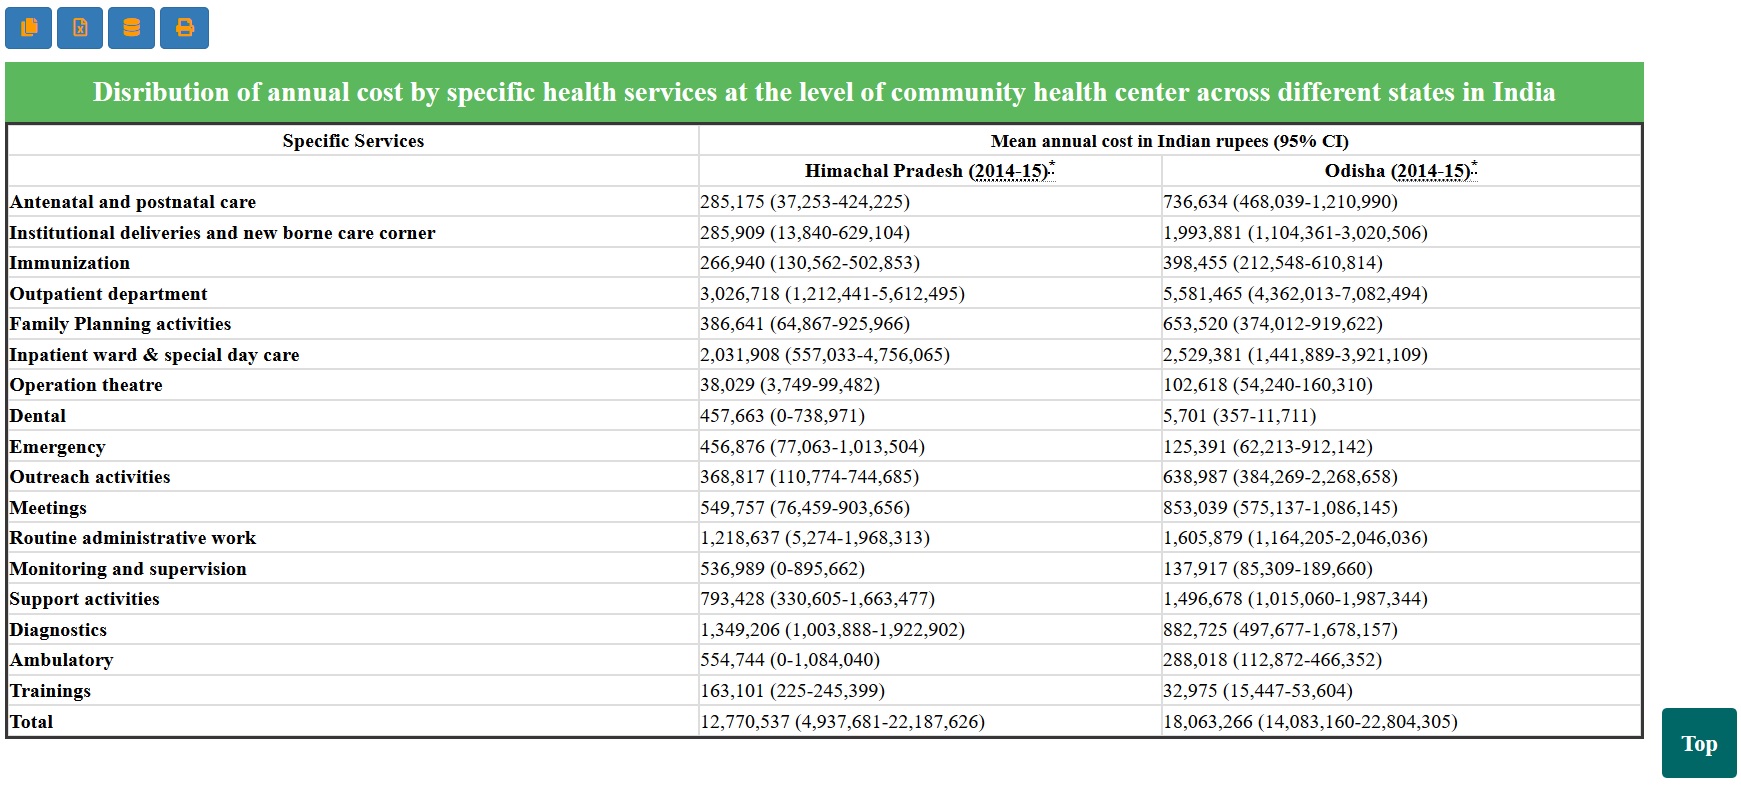
Output Tables for Total Cost Data
The screenshots below show the table generated for Community Health Centres in Himachal Pradesh and Odisha broken down by “Specific services”; “Input wise”; and by “Level of services”.
All tables can be downloaded as MS Excel tables.
Output table 1:
Output table 2:
Output table 3:
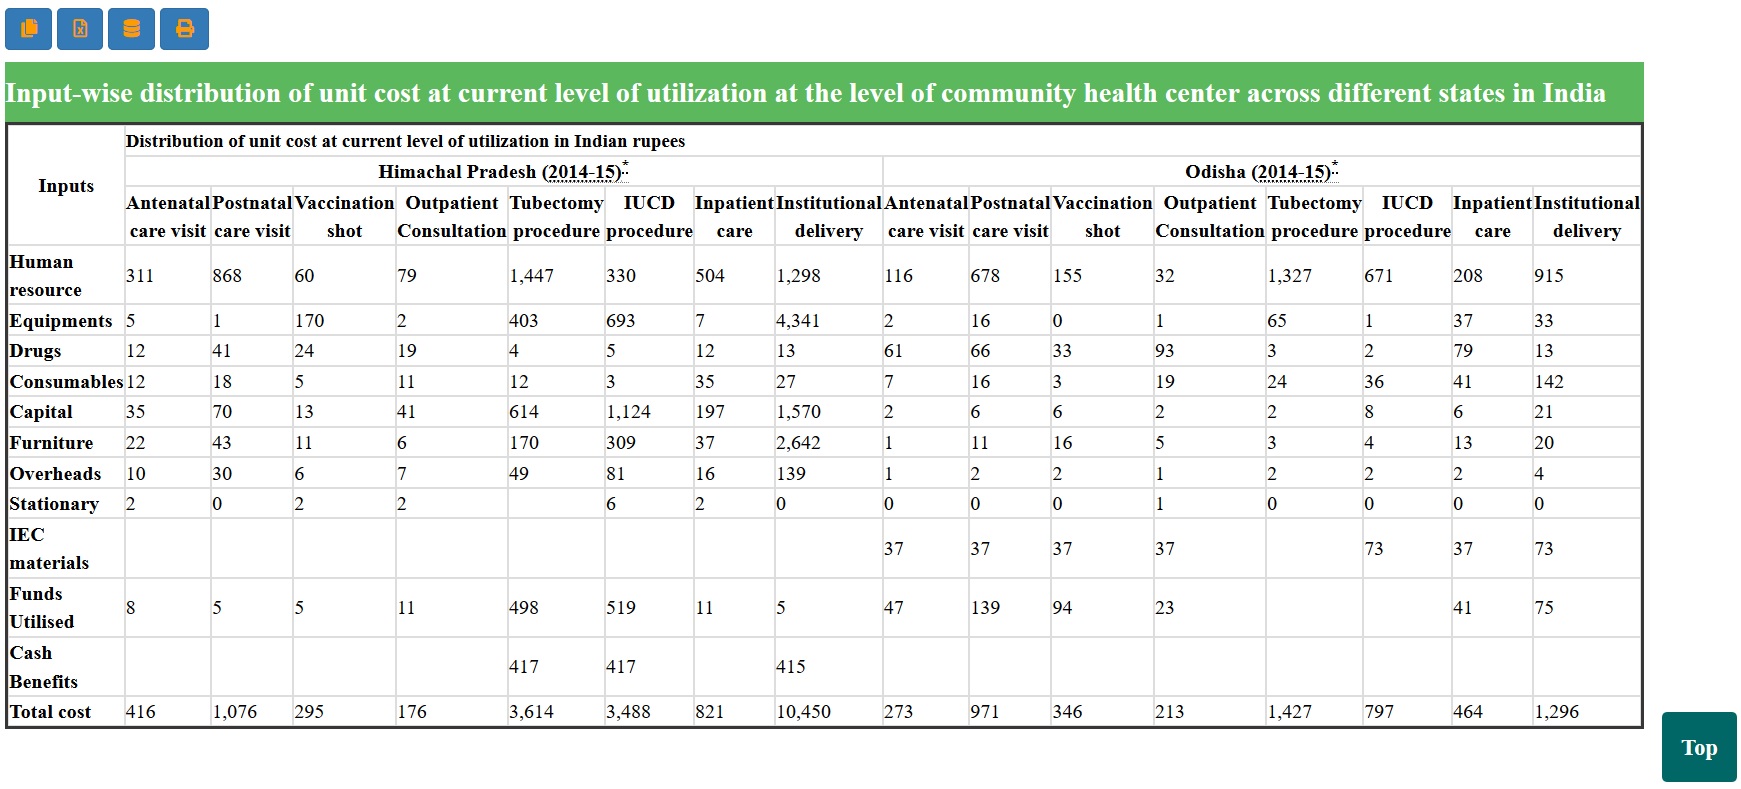
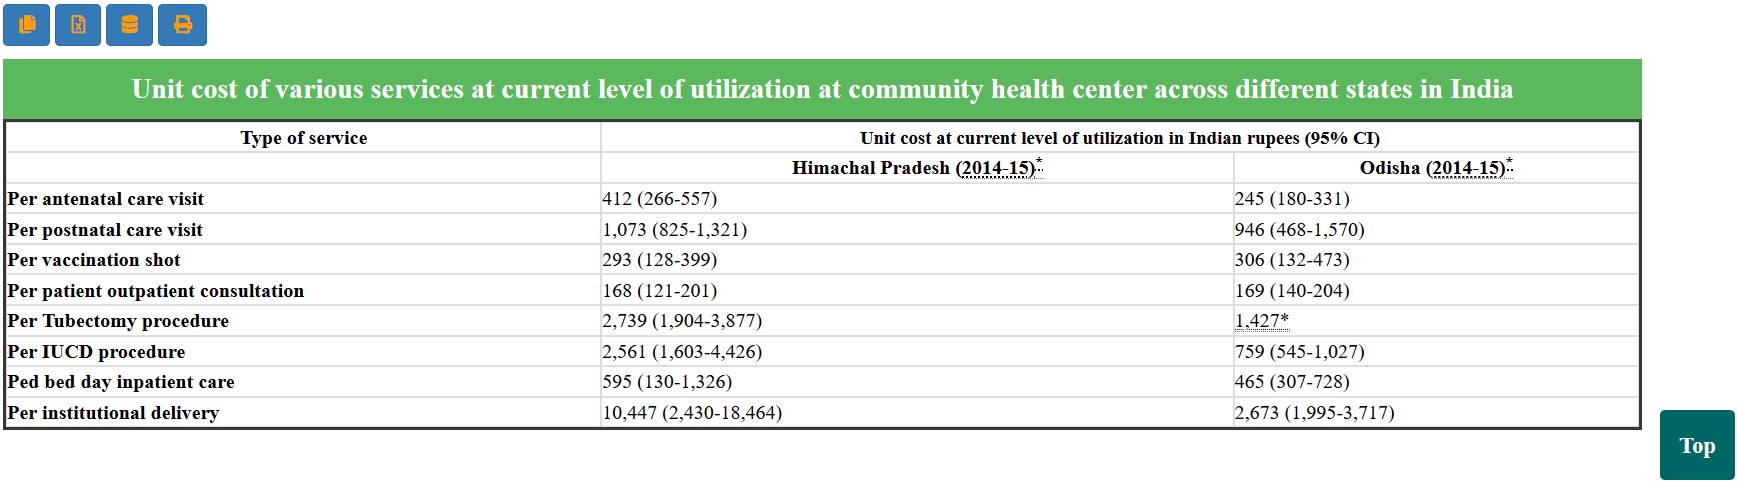
Output Tables for Unit Cost Data
The screenshots below show the Unit Cost tables generated for Community Health Centres in Himachal Pradesh and Odisha at current levels of utilisation. Unit costs are presented for each service provided overall and/or broken down by input.
All tables can be downloaded as MS Excel tables.
Output table 4:
Output table 5: